Scenario Link to heading
Azure Workbooks are great!, with an easy to use graphical designer to put together interactive queries and reports, no need to code, and available directly in the portal, no need to host a new application.
I have been using Azure Workbooks for the last couple of months to show summaries and details on failures for several business applications, some running as Logic Apps Standard, some as Azure Container Apps.
In this blog post I share the way I automate the deployment of these Workbooks, following patterns similar to the ones used in continuous deployment for regular applications. Here the workflow is not really an application in the sense of the need to pull dependencies, build and deploy, but by following these patterns, the need for inspection, approvals and reuse between environments is satisfied.
Creating log entries to populate the workbook Link to heading
This section is only to address the need of data to show in the workflow. Real applications are probably already creating all these logs. The code bellow is a simple console application, starting from Microsoft’s sample code, I added console output to be able to check the outcome live while running. The program creates logs entries simulating a process that runs every 5 seconds, doing 5 tasks every time, simulating some tasks taking longer and failures every once in a while.
 1using System.Diagnostics;
 2using Microsoft.ApplicationInsights.Channel;
 3using Microsoft.ApplicationInsights.Extensibility;
 4using Microsoft.Extensions.DependencyInjection;
 5using Microsoft.Extensions.Logging;
 6
 7using var channel = new InMemoryChannel();
 8
 9try
10{
11    IServiceCollection services = new ServiceCollection();
12    services.Configure<TelemetryConfiguration>(config => config.TelemetryChannel = channel);
13    services.AddLogging(builder =>
14    {
15        // Only Application Insights is registered as a logger provider
16        builder.AddApplicationInsights(
17            configureTelemetryConfiguration: (config) => config.ConnectionString = "---the connection string---",
18            configureApplicationInsightsLoggerOptions: (options) => { }
19        );
20        builder.AddJsonConsole(options =>
21        {
22            options.IncludeScopes = true;
23            options.TimestampFormat = "HH:mm:ss ";
24        });
25    });
26
27    var serviceProvider = services.BuildServiceProvider();
28    var logger = serviceProvider.GetRequiredService<ILogger<Program>>();
29    var cancellationTokenSource = new CancellationTokenSource();
30    await MainLoop(cancellationTokenSource.Token,
31        logger, 5000).ConfigureAwait(false);
32    logger.LogInformation("Logger is working...");
33}
34finally
35{
36    // Explicitly call Flush() followed by Delay, as required in console apps.
37    // This ensures that even if the application terminates, telemetry is sent to the back end.
38    channel.Flush();
39
40    await Task.Delay(TimeSpan.FromMilliseconds(1000));
41}
42
43return;
44
45static async Task MainLoop(
46    CancellationToken cancellationToken,
47    ILogger<Program> logger,
48    int frequencyInMilliSeconds)
49{
50    var totalRuns=0;
51    while (!cancellationToken.IsCancellationRequested && totalRuns < 200)
52    {
53        // Create a child task that runs in parallel
54        var childTask = Task.Run(async () =>
55        {
56            var transactionId = DateTime.UtcNow.ToString("yyyyMMddHHmmssfff");
57            using (logger.BeginScope("{transactionId}", transactionId))
58            {
59                var totalTimeTaken = new Stopwatch();
60                totalTimeTaken.Start();
61                logger.LogInformation(
62                    "Pest finder {eventTypeName}",
63                    "started");
64                try
65                {
66                    var stopWatch = new Stopwatch();
67                    for (var i = 1; i < 6; i++)
68                    {
69                        stopWatch.Restart();
70                        await Task.Delay(RandomNumber(1000, 20000), cancellationToken);
71                        if (RandomNumber(0, 100) > 90) throw new Exception("Pest finder overrun!");
72                        logger.LogInformation(
73                            "Pest finder task {taskNumber} took {timeTaken}ms",
74                            i,
75                            stopWatch.ElapsedMilliseconds);
76                    }
77                    logger.LogInformation(
78                        "Pest finder {eventTypeName} and took {totalTimeTaken}ms",
79                        "completed", totalTimeTaken.ElapsedMilliseconds);
80                }
81                catch (Exception ex)
82                {
83                    logger.LogError(ex,
84                        "Pest finder {eventTypeName} with error {errorMessage} and took {totalTimeTaken}ms",
85                        "completed", ex.Message, totalTimeTaken.ElapsedMilliseconds);
86                }
87            }
88        });
89        await Task.Delay(frequencyInMilliSeconds, cancellationToken).ConfigureAwait(false);
90        totalRuns++;
91    }
92}
93
94static int RandomNumber(int min, int max)
95{
96    var random = new Random();
97    return random.Next(min, max);
98}
Creating the workbook Link to heading
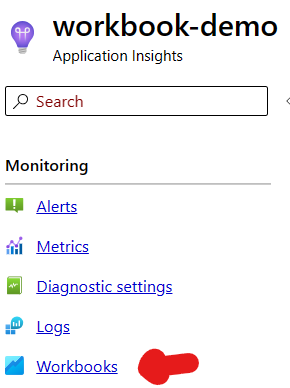
Now that we have some logs in place, its time to create the workbook. In the Azure Portal, find the application insights instance which was receiving these logs, then navigate to workbooks
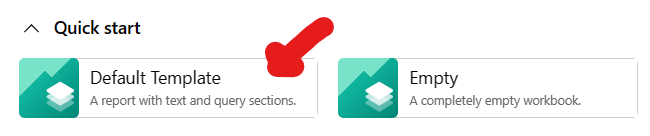
The workbooks screen offers two templates, select the default template
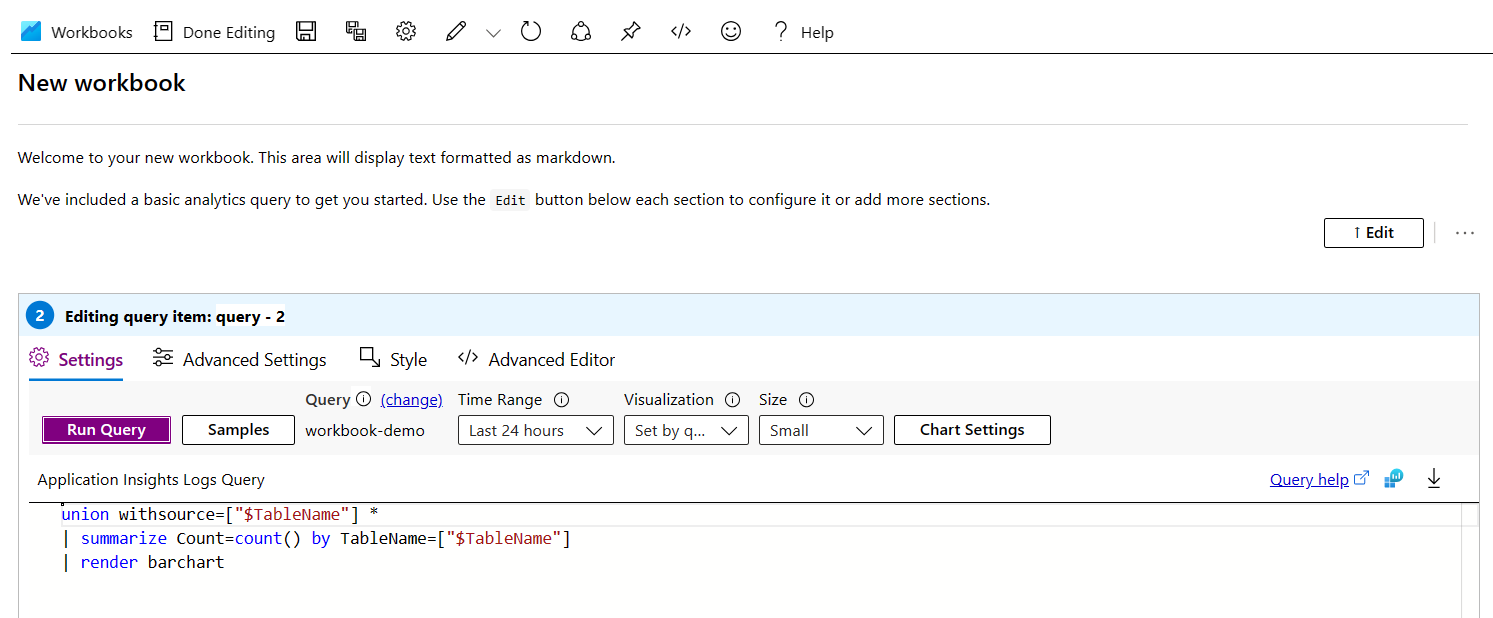
Workbooks are composed of blocks, added vertically one after the other. The default template adds two blocks, one text block and one query block
I updated the query in the query block according to the logs I created
union * | where customDimensions.eventTypeName == 'completed' | summarize count() by  bin(timestamp, 1m), itemType
| render barchart
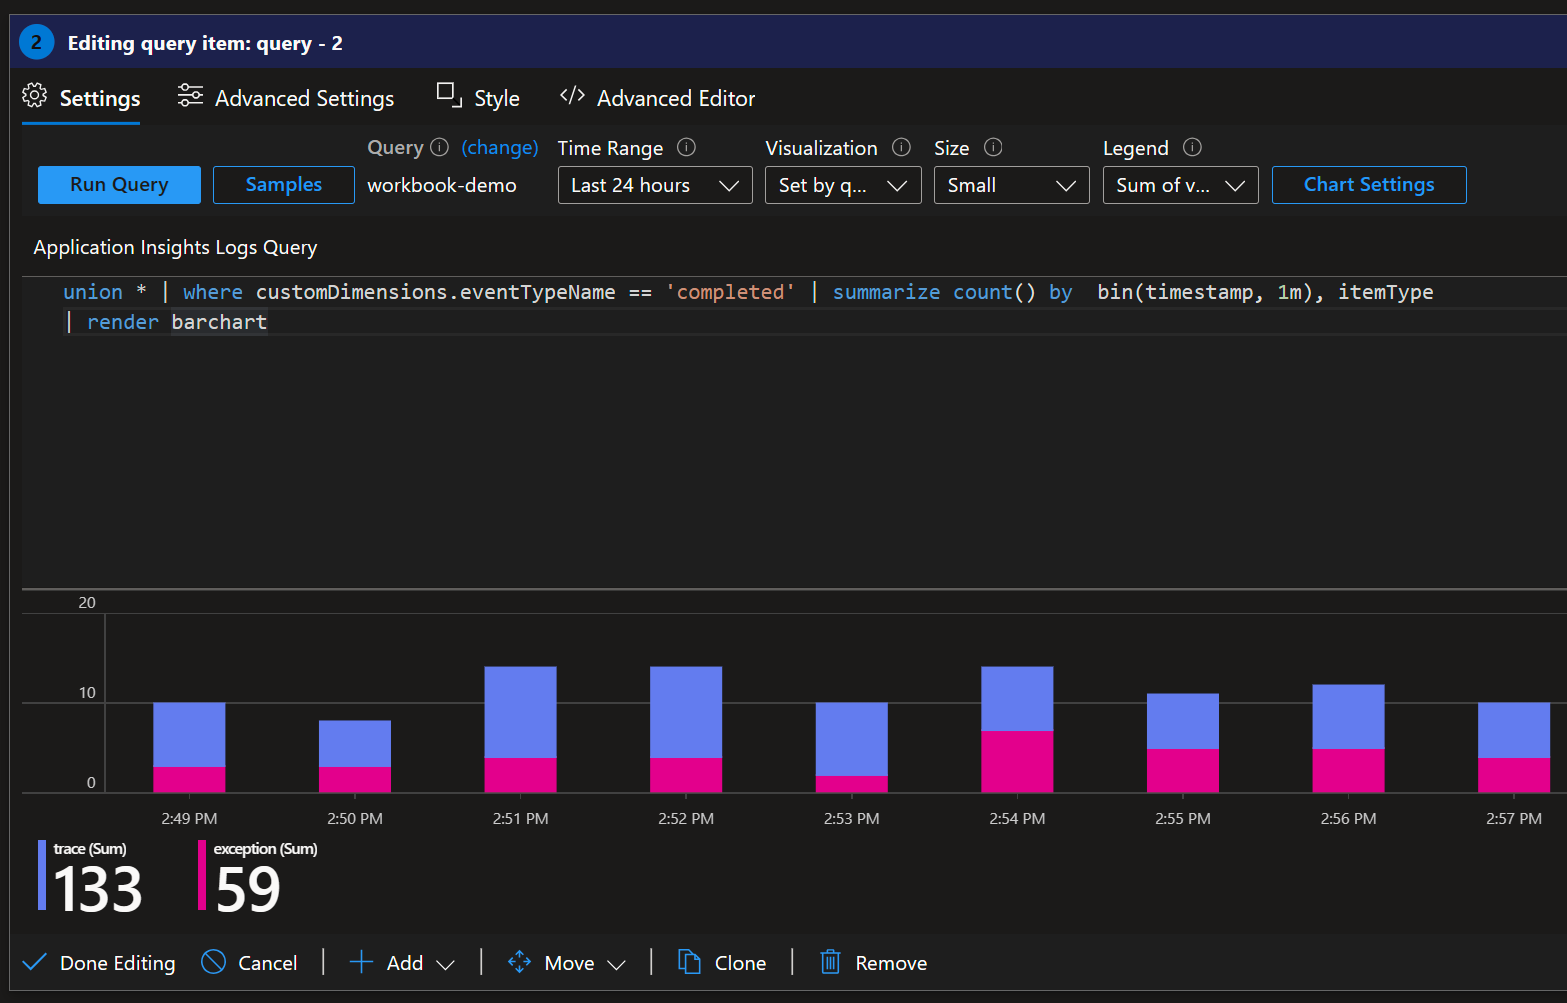
And this already shows the value of workbooks!, the ability to produce very nice reports and summaries from logs, without code and without deploying an additional application. This first query shows a summary.
I used the +Add option to add a new query block
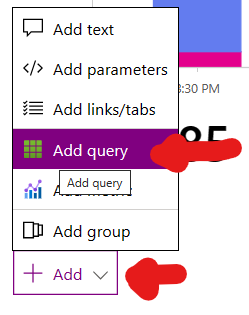
and in this next query I’m getting the details of all the processes that failed
exceptions | project timestamp, TransactionId = customDimensions.transactionId, Error = customDimensions.errorMessage
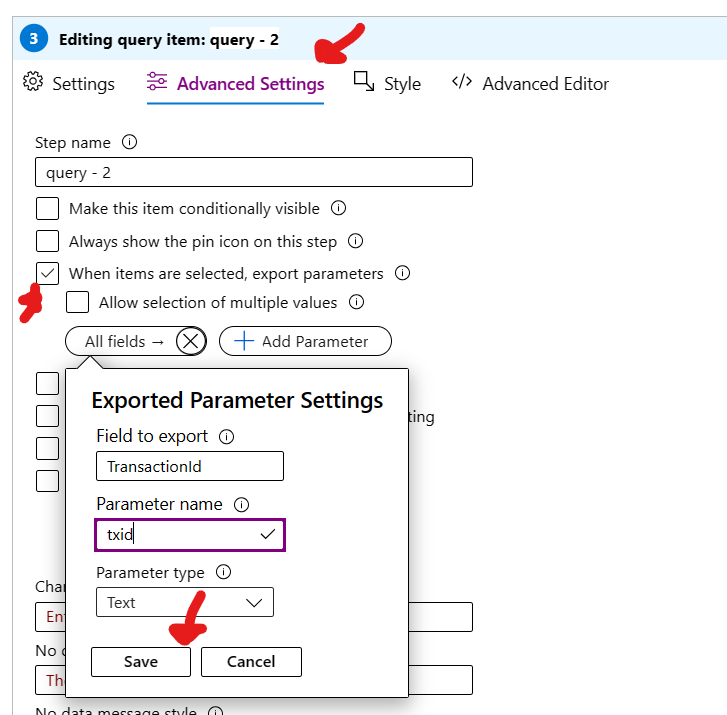
To add some interactivity I configured the “export parameter” feature so that when a row from the results is selected, the selected value is made available as a parameter for the next query
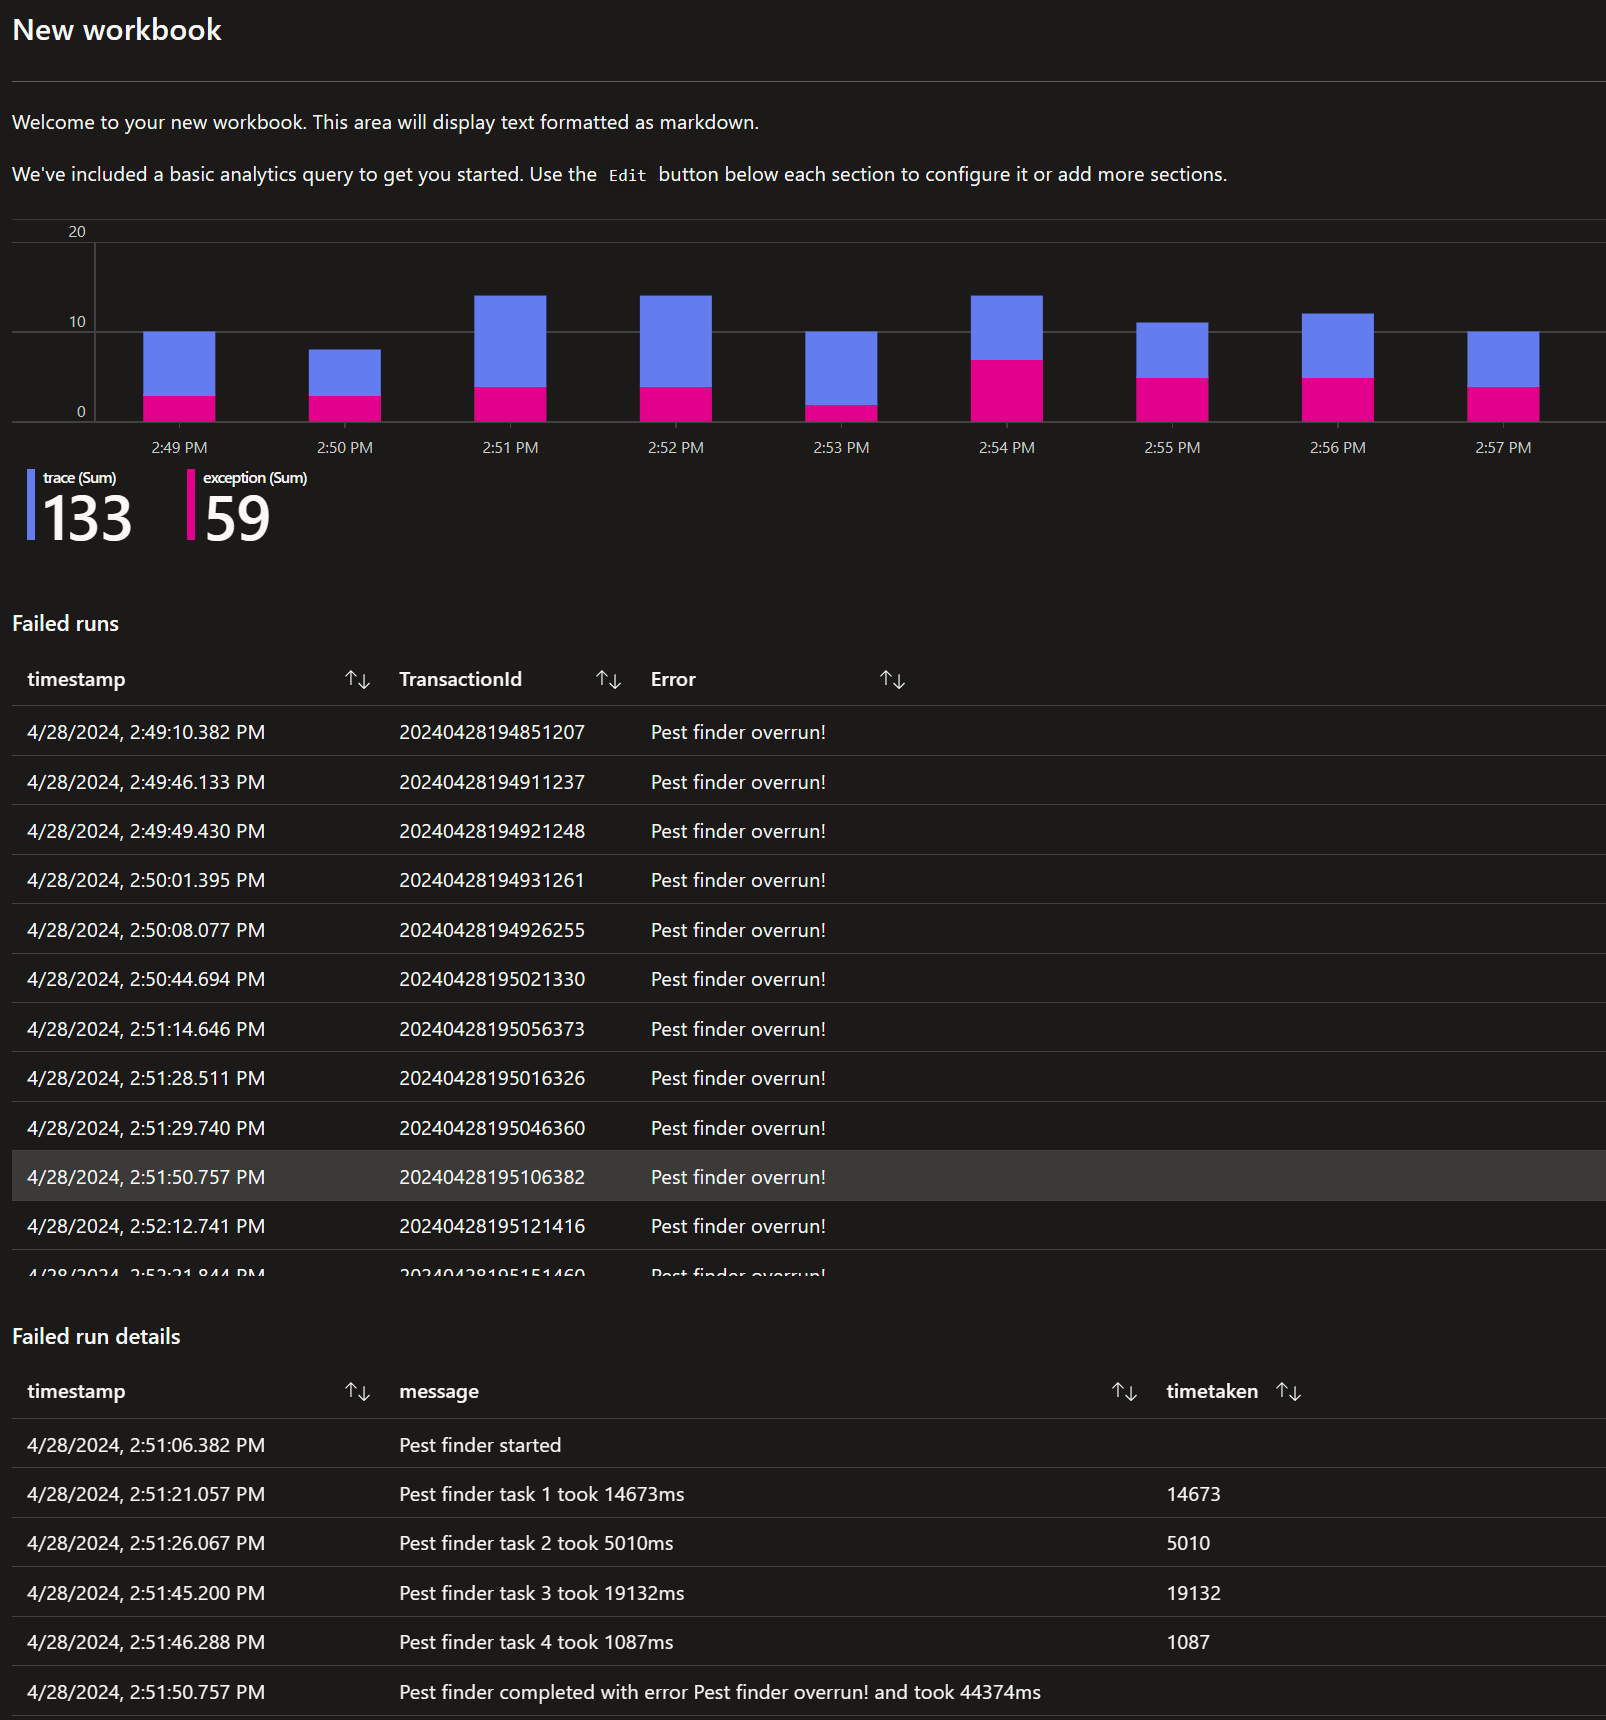
Next I added the last query, to show all the log entries for that process run
union traces,exceptions | where customDimensions.transactionId == {txid}
| order by timestamp asc
| project timestamp, message = iif(itemType=='trace', message, customDimensions.FormattedMessage), timetaken = customDimensions.timeTaken
The final result looks like this
Workbooks also allow “link” columns, with the ability to directly open Azure Portal blades or invoke actions, as shown here for Logic Apps Standard where the workbook includes links to the run details and to the “resubmit” action for the workflow.
Creating the pipeline Link to heading
The workbook is now in place and working, this however was done directly in the Azure Portal, manually, something that I don’t want to repeat for my TEST, STAGING, PERF or PRODUCTION environments. Just like with code, ideally, this needs to be version managed and go though deployment pipelines that parameterize by environment when needed, and control the approvals process to promote from lower to higher environments.
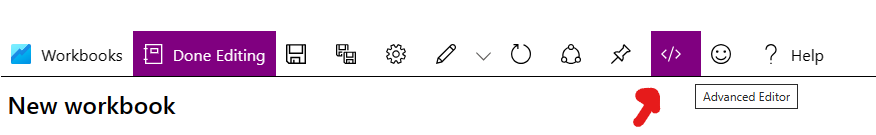
The workbooks user interface in the portal already provides some help for this by producing the ARM template needed to deploy the workbook via the Azure CLI. To obtain the ARM template, in the workbook editor view select the advanced editor
Then use the ARM template from the options offered by the Azure Portal
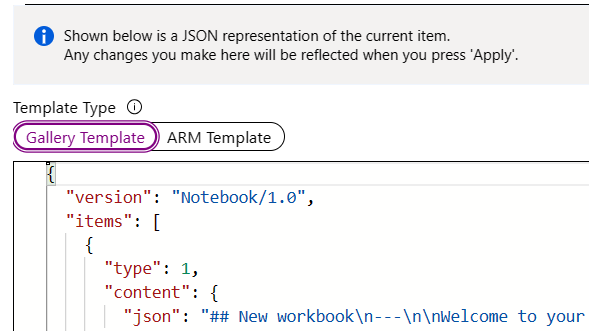
This option works, however the content of the workbook is all in one single place, the serializedData property, which makes it harder to inspect when thinking about code reviews and pull requests. The option I use is the first one, the “Gallery template” option, which provides the full content of the workbook in an easy to read and inspect JSON format.
To use this option I save this content as a JSON file, which I then add to source control, then pull during deployment using the loadTextContent bicep function.
Assuming separate subscriptions per environment, my bicep template looks like this, and a critical piece is the uniqueness of the name of the workflow. This name needs to be unique, and the same between pipeline runs to ensure the workbook is updated instead of adding a new workbook. The GUID function accepts as many parameters as needed so depending on the project I might need to add more parameters to make it unique.
 1@description('The datacenter to use for the deployment.')
 2param location string = resourceGroup().location
 3param environmentName string
 4param environmentShortNameUpperCase string = toUpper(environmentName)
 5param workbookSourceId string = '/subscriptions/${subscription().subscriptionId}/resourceGroups/${resourceGroup().name}/providers/microsoft.insights/components/appinsights-${environmentName}'
 6resource existing_application_insights 'Microsoft.Insights/components@2020-02-02' existing = {
 7  name: 'appinsights-${environmentName}'
 8  scope: resourceGroup()
 9}
10
11resource ProcessRunsSummaryWorkbook 'Microsoft.Insights/workbooks@2023-06-01' = {
12  name: guid(subscription().id, resourceGroup().id, existing_application_insights.id)
13  location: location
14  tags: {
15    costCenter: 'Demos'
16    project: 'Demos'
17  }
18  kind: 'shared'
19  properties: {
20    category: 'workbook'
21    displayName: 'Pest control runs - ${environmentShortNameUpperCase}'
22    serializedData: loadTextContent('PestControlWorkbook.json')
23    sourceId: workbookSourceId
24    version: '1.0'
25  }
26  dependsOn: [
27    existing_application_insights
28  ]
29}
To deploy this bicep template I use the Azure Devops deployment task
 1- task: AzureResourceManagerTemplateDeployment@3
 2    displayName: 'Deploy Workbook'
 3    inputs:
 4    azureResourceManagerConnection: ${{ parameters.serviceConnection }}
 5    subscriptionId: '$(subscriptionId)'
 6    action: 'Create Or Update Resource Group'
 7    resourceGroupName: $(resourceGroupName)
 8    location: $(resourceGroupLocation)
 9    csmFile: '$(Pipeline.Workspace)/$(artifactName)/template-workbooks.bicep'
10    overrideParameters: >-
11        -environmentName $(environmentShortName)
12    deploymentMode: 'Incremental'
Which is called by a multistage pipeline that takes care of each of the environments, and where a typical stage looks like this
 1- stage: STAGING
 2  displayName: 'STAGING Deployment'
 3  variables:
 4  - template: pipeline-variables.yml
 5    parameters:
 6      environmentShortName: 'stg'
 7      subscriptionId: '---my guid---'
 8  jobs:
 9  - template: templates/iac-template.yml
10    parameters:
11      azDevOpsEnvironment: 'Pest Control Staging'
12      serviceConnection: 'azure-staging-service-connection'
A complete example of multistage pipelines for infrastructure as code (IaC) and continuous integration (CI) and continuous delivery (CD) can be found in the Microsoft guidance for DevOps with Azure Standard Logic Apps